About Fibonaci Projection Calculator
About Fibonacci Price Projections Traders often get excited when they believe they can use an indicator or tool to ‘project’ prices into the future, but in reality, price projections just give us a possible target that...
About Fibonacci Price Projections
Traders often get excited when they believe they can use an indicator or tool to ‘project’ prices into the future, but in reality, price projections just give us a possible target that the market may or may not achieve.
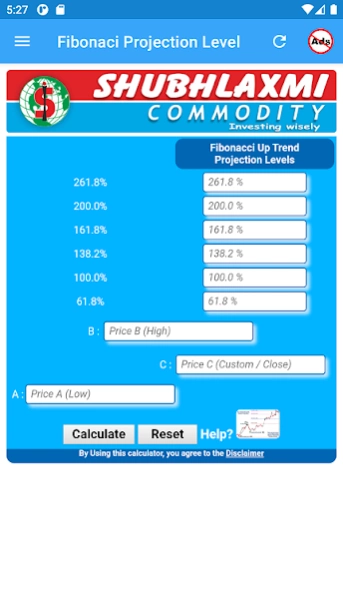
Traders use Fibonacci Price Projections (also called “Extensions”) in a similar manner as Fibonacci Retracements, but they are looking to project where price will travel upwards to hit resistance (in an uptrend) rather than find where price will find support via retracements.
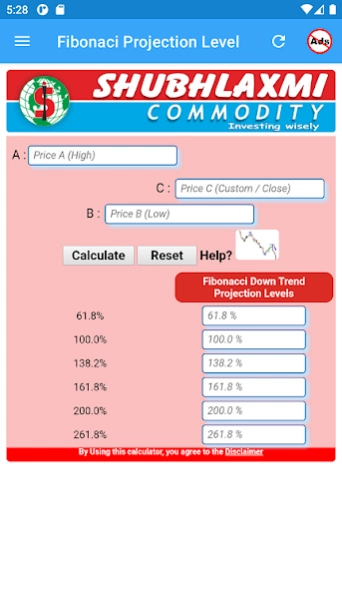
While traders often use Fibonacci ratios 38.2%, 50.0%, and 61.8% for retracements, it is quite common to use 61.8%, 100.0%, 132.8%, and 161.8% for Price Projections and Extensions.
What exactly does this mean?
To draw a Fibonacci Projection grid, we’ll need to identify a swing low, swing high, and price retracement against the swing high (for uptrends – reverse the definition for projecting price in a down-trend).
This example is done in the context of an uptrend. We start our projection grid off a Swing Low and then draw the first line to the next Swing High.
1. In an up-trend, Identify a Swing Low (retracement)
2. Use your Fibonacci Projection Tool to move from the Swing Low to the next Swing High for the ‘base’.
3. Draw the Second Line from the Swing High to a Retracement (Swing) Low
The first line (from Swing Low to Swing High) serves as the “Measurement Swing” by which we will soon create Fibonacci Projections. The “Retracement” Swing provides the base from which to project Fibonacci relationships of the first swing.
For example, if the original swing is 100 and our retracement is 70 down, we would take the Fibonacci ratios of the 100 swing (61.8%, 100%, etc) and then add those values to the Retracement Low. Luckily, most software programs do all this for us with three clicks – you just need to know where to point your mouse to click.
Now, unlike the Fibonacci Retracement tool where we are looking to find support, we are now looking to find points above price where the market is likely to experience Overhead Resistance. These will now serve as Profit Targets to help us establish risk/reward relationships.
Previous Versions
Here you can find the changelog of Fibonaci Projection Calculator since it was posted on our website on 2016-12-30 14:01:41.
The latest version is and it was updated on 2024-04-22 12:16:09. See below the changes in each version.
Fibonaci Projection Calculator version
Updated At: 2023-09-16
Fibonaci Projection Calculator version
Updated At: 2021-10-09
Changes: V-1.2.2
added profit calculator
added stock average calculator
added Multi average calculator
added Stop Loss target calculator
Ads Removal Button Added
Fibonaci Projection Calculator version
Updated At: 2020-01-11
Changes: Version 1.2
fig miner bug
2 New Permission add Location for Google Map
New Permission add PHONE-CALL for Direct Call for Support Team
Disclaimer
Official Google Play Link
We do not host Fibonaci Projection Calculator on our servers. We did not scan it for viruses, adware, spyware or other type of malware. This app is hosted by Google and passed their terms and conditions to be listed there. We recommend caution when installing it.
The Google Play link for Fibonaci Projection Calculator is provided to you by apps112.com without any warranties, representations or guarantees of any kind, so access it at your own risk.
If you have questions regarding this particular app contact the publisher directly. For questions about the functionalities of apps112.com contact us.